Key Metrics: Quantifying Output Quality
Slop. It's not just annoying — it's exhausting. You're absolutely right to be annoyed by it, and in this blog I will delve into a solution.
You've probably noticed most models have their favorite words or phrases they overuse, like "—", "it's not X, it's Y", or "delve". Before investigating the solution, I first address the metrics I use to measure output quality. Instead of measuring "quality" itself, which is not well defined, I measure similarity to human writing samples.
Metrics
N-Gram Token Distribution L2 Distance
This metric captures word choice similarity, and is useful for detecting overuse of certain words/phrases, like emdashes.
Given a set of writing samples, compute the N-gram token distribution as the number of times each N-gram appears over total number of N-grams, so dimension i measures the frequency of token i. To compare the two distributions, I use L2 (euclidean) distanceNote that metrics like KL or JS Divergence do not work well here because there are generally many tokens that appear in reference but not output, or vice versa, and these have outsized contribution to the overall metric.. I primarily focus on L2 distance for 1-grams, see Appendix 3 for L2 on 2-grams and 3-grams.
Maximum Mean Discrepancy (MMD, Gretton)
This metric gets embedding for each text sample, and computes a distance between the embedding distributions. Since it's using embeddings, it measures content similarity. For example, it captures if LLM outputs are overly generic and don't go into detail, or if they overuse a certain concept (like goblins).
More specifically, given distributions P and Q, MMD compares the average distance from samples from the same distribution (first 2 terms in the formula) with the average distance between distributions. It will be 0 if and only if the two distributions are the same. To compute the distances the formula uses an embedding model (Llama-embed-nemotron-8B, Babakhin) and a Gaussian RBF kernel k.
I use MMD instead of other distances using embedding metrics since it was designed to test whether two sets of samples come from the same distribution, which aligns with the primary goal of DFT.
Judge Model Quality (JMQ)
This metric gives a judge modelGPT5.4-mini, with prompts in randomized order, to prevent positional bias., a prompt and completions from human vs. model output. Judge Model Quality score (JMQ) is defined as 2 times the win rate for model outputs. (Since the goal is to match human text, the optimal score here is a 50% win rate. I multiply by 2 so that the range is 0–1.0). For the main body of this post, I focus on overall quality for JMQ. For fine grained analysis of creativity, coherence, depth, etc. as well as comparison of different judge models, see Appendix 8.
We now use these metrics to quantify how models trained with SFT fail to match the training data distribution.
The Problem: SFT Is Not All You Need
When training a frontier model, there are many post training steps, such as RLHF. A reasonable hypothesis for why LLM text has so many slop signs is from reward hacking during these steps, and that if you removed these steps then it would be easy to create higher quality writing.
However, there are still clear differences between SFT model outputs and human samples. To quantify this, I started from models in the Qwen3 family (Yang)I initially tried starting from Qwen3 Base models, however these had bad MMD and JMQ scores due to poor instruction following. The instruct tuned Qwen3 models (e.g. 14B) performed much better. and trained on a subset of fineweb (see Appendix 2 for data details). I then graphed how MMD, JMQ, and L2 Token Distance depend on sampler settings between the model output and human samples on a held out test set. These graphs show the dependence on temperature, see appendix for top_p and top_k.
Models are trained on a subset of 185K samples from fineweb (See Appendix 2 for details). Results are calculated on a set of 2000 held-out samples (JMQ only uses first 400 of these).
How to read the figure
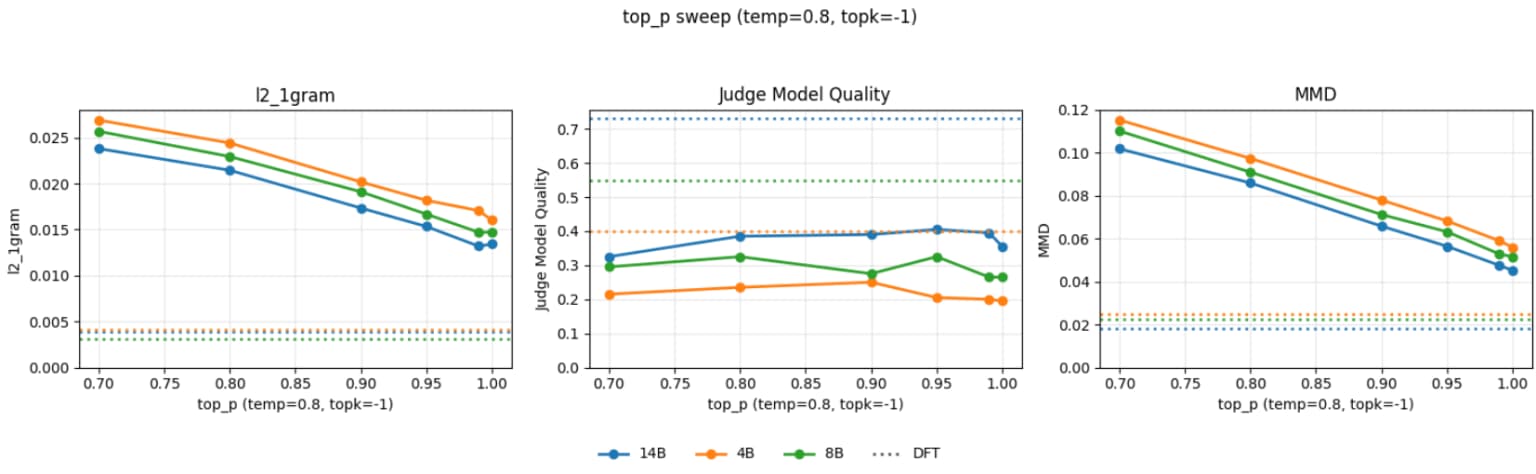
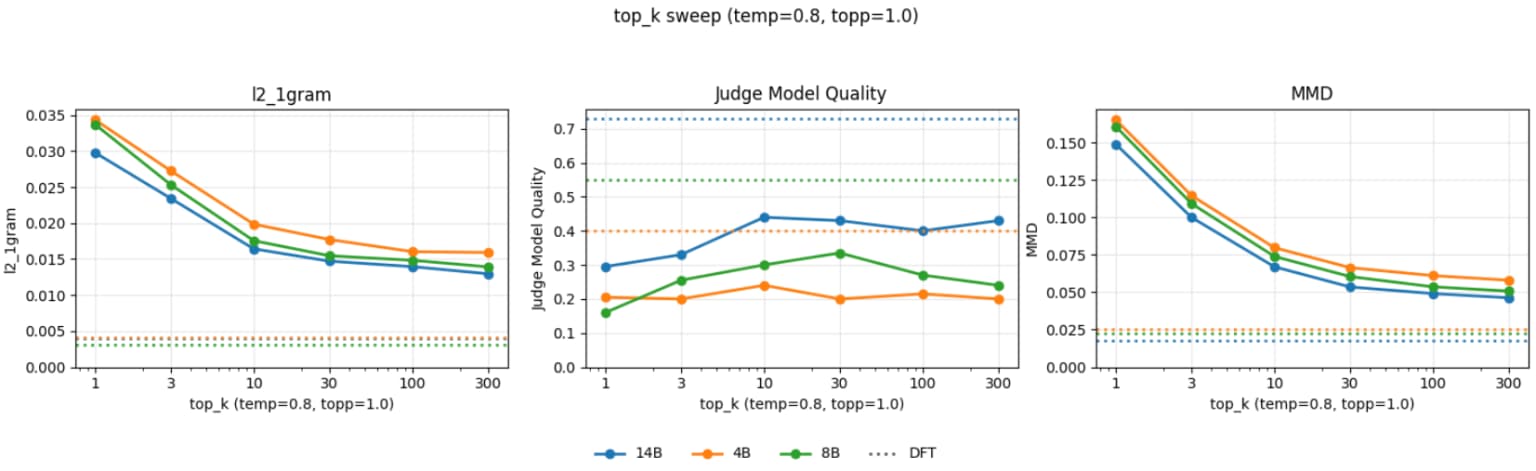
Note that in the graphs below, the dotted line for DFT is from a fixed sampler setting. I extended it as a line instead of a point to more dramatically emphasize how a single DFT model beats SFT at any hyperparameter setting.
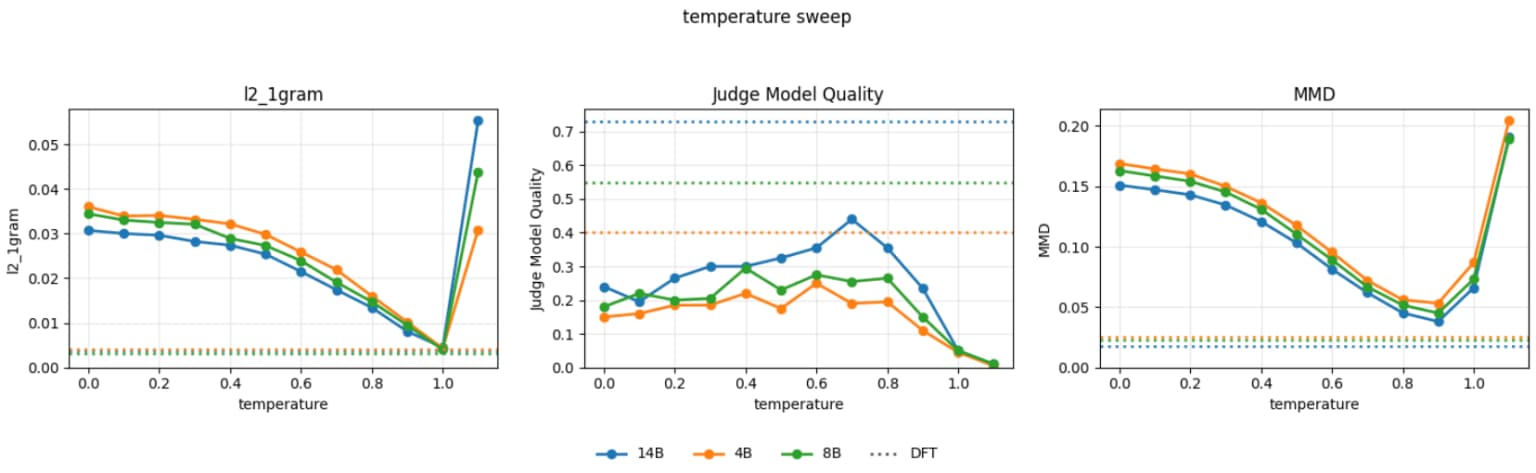
These graphs suggest SFT is failing to fully capture the training data distribution. If it was perfectly matching the training data distribution, then MMD would be 0 and JMQ would be 1.0.
There are many proposed explanations for why SFT fails to match the training distribution, including exposure bias (Ranzato, Bengio), unreliable tail probabilities (Holtzman), likelihood objective (Welleck), miscalibration (Braverman), local typicality (Meister), etc. However, this simplest explanation is that at a high level, SFT focuses on training individual samples and in doing so misses out on distribution level information. DFT trains at this higher level, optimizing the distribution of outputs so that it better matches the training data.
Sample Model Outputs
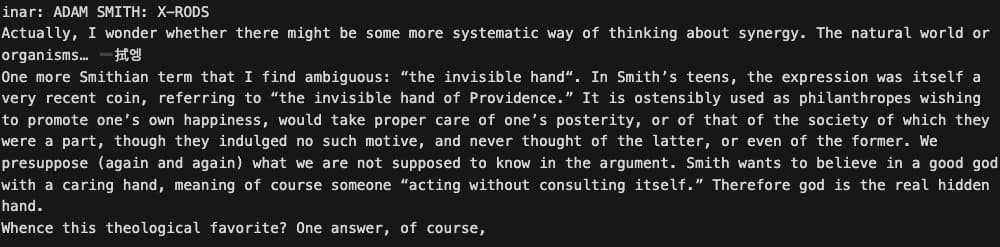
I compare outputs for the same prompt from the SFT model with best judge preference (14B, T=0.7), the best token distribution (14B, T=1.0), and DFT.
I only include a short section of each output, to highlight differences without requiring reading the full text.
Prompt (including outline of response)

SFT T=0.7
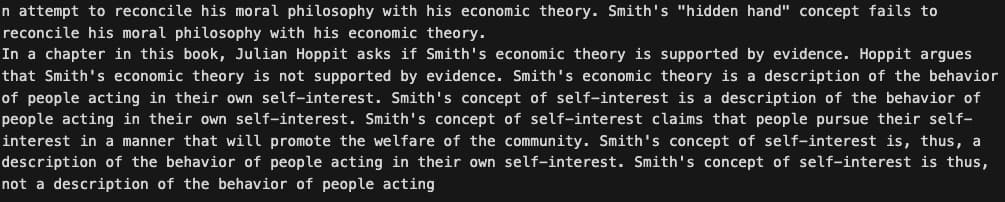
T=1.0
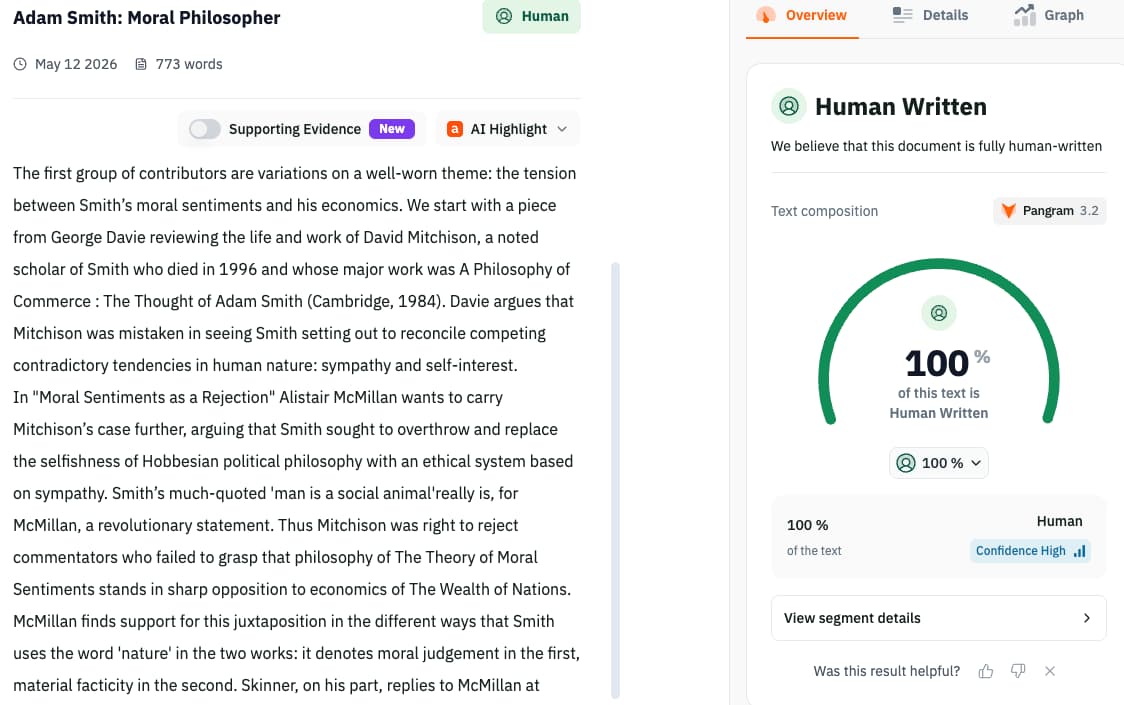
DFT

Some differences to notice
SFT T=0.7
- Repetitive structure. All the sentences except for two start with "Smith's."
- The text is generic, without deeper details.
SFT T=1.0
- Big transitions, e.g. from "systematic way of thinking about synergy" to "The natural world or organisms" to economic theory.
- Non-English characters randomly added: "拭엥"The first is a Chinese character meaning "to wipe", the second is Korean for "huh?" or "what?". Perhaps the model was also surprised that it switched to Chinese..
How these samples were chosen
Not all SFT writing samples are this bad, these examples were chosen because they demonstrated repetitiveness at low temperatures and incoherence at higher temps for the same prompt. At intermediate temperatures these same problems happen, just at different frequencies, for example at temp=0.8, 44% of outputs have similar amounts of repetitiveness, and at temp=0.9, over 9% of outputs have non-English characters. See Appendix 1 for more details.
Metric Graphs for top_p and top_k
Quantifying Repetitiveness and Non-English Tokens
The table below continues the analysis from Section 3, quantifying the number of samples with non-English characters.
To quantify repetitiveness, I measured what percentage of texts have at least 3 sentences in a row where each sentence starts with the same wordIt seemed suspicious that 17.4% of human generated text has 3 sentences with the same start word in a row, that seems too high. Inspecting the data, all the examples look valid, so it's unlikely to be a bug. Mostly this is from lists, e.g. a list of questions that start with "How", or 3 nouns in a row ("The Lamu Archipelago…", "The islands lie between…", "The largest island…")..
| Model | % texts |
|---|---|
| Human | 17.4% |
| SFT T=0.7 | 53.3% |
| SFT T=0.8 | 43.8% |
| SFT T=0.9 | 29.9% |
| SFT T=1.0 | 16.3% |
| DFT | 18.6% |
| Model | % texts |
|---|---|
| Human training data | 0.1% |
| SFT T=0.7 | 1% |
| SFT T=0.8 | 3.2% |
| SFT T=0.9 | 9.1% |
| SFT T=1.0 | 36.45% |
| DFT | 8.1% |
You can see that at all temperatures, a large portion of samples have either repetitive outputs, or random non-English characters.
Data Details
I used a subset of fineweb (Penedo), a collection of high quality web documents. I found that many of the fineweb samples included parts that were not suitable for quality writing output, for example, contact information at the end of a webpage, captions for images/figures that were not included in the writing sample, etc. I used Qwen3-32B to parse the documents line by line, and remove any line that was not relevant to the main writing sample.
To create input/output pairs from these cleaned writing samples, I used Qwen3-32B to generate a prompt that would result in the output. I used several different variants of the prompt to ensure diveresity (e.g. asking for longer/shorter/more detailed prompts). Similarly I used it to extract the use case and style. For the outlines I used GPT-5-mini to write the outline of the response, including any facts/quotes that appeared. In the training/test mix, 25% of the samples had an empty outline, all other samples had outlines.
I also added flags for target length in tokens, and if emdashes are allowed. The final prompt specifies length, whether emdashes are allowed or not, the use case, the style, the prompt, and an outline of the response.
Results
The optimal value for MMD vs. JMQ vs. L2 metrics in the graphs for SFT above use different sampling parameters. L2 metrics are optimized by Temp=1, but MMD and JMQ are optimized at lower temps.
For a strong baseline, I ran hyperparameter search over several learning rates, lora vs. full fine tuning, and different sampler settings, then used the best metric value over all hparam configurations as the value for the a "super baseline". This means the super-baseline has metric scores better than is possible for any single hyperparameter setting.
(Also, note that there is randomness in the evaluation metrics, and the max over noisy estimates gives an overoptimistic estimate of the true value, which makes the super baseline even more difficult to beat)
Important note: I only do this "max over all hparam configurations" for the baseline. For DFT results I use a single model with a fixed set of hparam values.
Distribution Fine Tuning (DFT) outperforms the SFT superbaseline. A 4B model trained with DFT beats a 14B superbaseline at MMD and an 8B superbaseline at JMQ.
| Model | MMD ↓ | JMQ ↑ | Token L2 ↓ |
|---|---|---|---|
| 4B SuperBaseline | 0.047 | 0.27 | 0.0040 |
| 4B DFT | 0.025 | 0.4 | 0.0042 |
| 8B SuperBaseline | 0.041 | 0.37 | 0.0040 |
| 8B DFT | 0.023 | 0.56 | 0.0031 |
| 14B SuperBaseline | 0.037 | 0.49 | 0.0039 |
| 14B DFT | 0.018 | 0.80 | 0.0036 |
Bold marks the better value in each same-size pair. Values are reproduced as printed in the paper.
These results do not require extreme compute; all training was done on my local 6x 6000 Ada server.
More Metrics
To show that DFT is not just overfitting to certain metrics, I use 7 more metrics to analyze text quality.
Metric Explanations
JSD on Token 1-Grams
Compute the token distribution of model and human outputs, then compute Jensen Shannon Divergence. This has very large contributions from tokens that appear in one output and not the other.
FID
Frechet Inception Distance (Heusel), using a SOTA embedding model (nvidia/llama-embed-nemotron-8b) to compute the embeddings. One drawback of this metric is that FID assumes the distributions are Gaussian, and text outputs generally are not Gaussian.
L2 Distance on Token 2-Grams and 3-Grams
self explanatory
chrF
Computes the F-score of character level n-grams between model output and reference (Popović).
BLEU vs. Human Reference
At a high level, BLEU (Papineni) computes clipped n-gram precision for n=1..4, then computes the geometric mean of these precisions, with a brevity penalty. BLEU is most relevant when there is a gold standard response, for example in translation. Here it is not quite as relevant, because prompts can be open ended (e.g. “write an essay about LLMs” could have many good completions that have very little overlap with each other).
MAUVE
MAUVE (Pillutla) embeds each texts from model and reference into feature space, quantize by clustering, compute divergence at different False positive/False Negative weightings, and return area under the curve. I found that MAUVE saturated too quickly, even 4B baseline could get .997+. The MAUVE github suggests that when MAUVE score saturates like this, you can increase the mauve_scaling_parameter. However, that also increases the between run variance, and as you can see by comparing 4B to 8B SuperBaseline, the variance is already high enough to make it difficult to compare models accurately (8B should be better than 4B, but it is not).
| Metric | SFT base | DFT |
|---|---|---|
| JSD on token 1-gram ↓ | 0.025 | 0.024 |
| FID ↓ | 235 | 182 |
| L2 token 2-grams ↓ | 0.0018 | 0.0019 |
| L2 token 3-grams ↓ | 0.00141 | 0.00140 |
| ChrF ↑ | 45.4 | 46.2 |
| BLEU vs. human ↑ | 0.057 | 0.042 |
| MAUVE ↑ | .997 | .996 |
| Metric | SFT base | DFT |
|---|---|---|
| JSD on token 1-gram ↓ | 0.026 | 0.023 |
| FID ↓ | 223 | 176 |
| L2 token 2-grams ↓ | 0.0019 | 0.0016 |
| L2 token 3-grams ↓ | 0.0014 | 0.0014 |
| ChrF ↑ | 45.7 | 46.2 |
| BLEU vs. human ↑ | 0.058* | 0.045 |
| MAUVE ↑ | 0.996 | 0.997 |
| Metric | SFT base | DFT |
|---|---|---|
| JSD on token 1-gram ↓ | .025 | .023 |
| FID ↓ | 201 | 164 |
| L2 token 2-grams ↓ | 0.0017 | .0018 |
| L2 token 3-grams ↓ | 0.0015 | 0.0014 |
| ChrF ↑ | 46.1 | 46.7 |
| BLEU vs. human ↑ | 0.062 | 0.051 |
| MAUVE ↑ | 0.997 | 0.997 |
Values are reproduced as printed, including the paper's inconsistent leading zeroes and the unexplained 8B BLEU asterisk.
Why Is BLEU Worse?
The formula for BLEU is quite complex, but main idea is that it looks at 1,2,3, and 4 grams in the model output and checks how many of those appear in the reference. Analyzing the outputs of the SFT Superbaseline vs. DFT, I noticed that this value from the superbaseline comes from sampling parameters temp = .8, top_k=2. This is quite a low value for top_k, and low top_k like this typically lead to bland/repetitive outputs. For a closer analysis, I saw the main difference in the BLEU score was being driven by fewer 3 and 4 grams appearing in the reference. I made a table of the top 3 and 4 grams in SFT output vs. DFT output with counts:
| 3 Gram | SFT output count | DFT output count |
|---|---|---|
| be used to | 621 | 55 |
| It is a | 520 | 42 |
| can be used | 509 | 71 |
| the number of | 501 | 134 |
| one of the | 430 | 408 |
In this case the BLEU score was higher because it overuses common grammatical patterns. That's exactly what I want to avoid with DFT, so I concluded that BLEU vs. human reference is not a good metric to use.
Effect of Data Size
How would the baseline perform if we had 2x as much data?
To answer this, I used the cheaper alternative of taking a checkpoint with half or 1/4 as much data using that for evaluations.
The table below shows comparison of superbaseline scores at quarter data, half data and full data. Note that we are training on web documents which are similar to the pretraining data, so most of the learning is just matching formatting. In the table below, we see continued improvement from quarter data to half data, but at full data results have plateaued, or even started to regress a little.
Note that the amount of data we are using is a tiny fraction of the total pretraining data, so it's reasonable to expect that past a certain point, improvement would be negligible compared to noise in training/eval processes. If we trained on 100x data we would probably see continued improvement in SFT superbaseline scores, but DFT can get us improvement much more cheaply.
| Super Baseline | MMD ↓ | JMQ ↑ | Token L2 ↓ |
|---|---|---|---|
| 4B-quarter data | .0497 | .23 | .0068 |
| 4B-half data | .0466 | .255 | .0040 |
| 4B-full data | .0477 | .265 | .0043 |
| 8B-quarter data | .042 | .34 | .006 |
| 8B-half data | .041 | .37 | .0046 |
| 8B-full data | .045 | .335 | .0040 |
| 14B-quarter data | .0379 | .475 | .0062 |
| 14B-half data | .037 | .49 | .0039 |
| 14B-full data | .038 | .44 | .0045 |
Values are reproduced as printed. Quarter and half data are earlier checkpoints; DFT comparison is the full-data model.
Comparison with Other Models
In this section I use the same test set to evaluate other models.
Author's Note
This is not a very good comparison because DFT is an algorithm to better match the training data distribution, and the metrics (with the exception of JMQ) measure distributional similarity on the test set. Since other models have been trained on different data and have other post training steps, we should not expect them to do well.
A few notes: As expected, MMD scores are much larger for other models. For Judge Model Quality, remember that this is the win rate times 2, so it's possible to go above 1.0. One note of caution: Judge models are known to prefer outputs from LLMs (Laurito), especially their own (Panickssery). So MMD and Token L2 are unfair against other models, and JMQ is unfair in their advantage.
| Model | MMD ↓ | JMQ ↑ | Token L2 ↓ |
|---|---|---|---|
| DFT 14B | 0.018 | 0.73 | 0.0039 |
| Claude 4.6 | 0.16 | 1.88 | .023 |
| Gemini3.1Pro | 0.17 | 1.86 | .025 |
| Kimi 2.5 | 0.16 | 1.84 | .031 |
| GPT 5.4 | .11 | 1.96 | .035 |
Fine-Grained Judge Model Analysis
The Judge Model Quality scores above evaluate the overall quality of the sample. In this section, we evaluate different criteria that affect writing quality, specifically clarity, coherence, creativity, depth, and prompt relevance.
The full super-baseline has 132 different evaluation sets for a single model size. Running all of these for each evaluation dimension would cost too much, so I used the same hyperparameters that maximized overall judge model quality for the 14B parameter model.
The judge model prompts are at the end of this appendix.
From this we see improvement in all dimensions, with greatest improvement in Depth (going deeper into details about the subject instead of generic surface level descriptions) and Creativity.
| Eval Dimension | 14B Baseline | 14B DFT |
|---|---|---|
| Clarity | 70.5 | 82.0 |
| Coherence | 54.5 | 70.0 |
| Creativity | 32.5 | 86.0 |
| Depth | 35.5 | 87.5 |
| Prompt Relevance | 44.0 | 75.0 |
I also compared the overall quality for different judge models, evaluating with Claude, Gemini and Grok models of different sizes. We see that although there is a high variance in baseline score across different models, we see consistent improvement with DFT.
| Model | 14B Baseline | 14B DFT | Relative change |
|---|---|---|---|
| Claude Sonnet 4.6 | 37 | 51 | +37% |
| Claude Sonnet | 19 | 46 | +142% |
| Gemini 3.1 Flash | 48 | 62 | +29% |
| Gemini 3.1 Pro Preview | 62 | 72 | +16% |
| Grok 3 mini | 54 | 84 | +56% |
| Grok 4.3 | 35 | 65 | +86% |
| GPT 5.5 | 37 | 41 | +11% |
Judge Prompts
Overall Quality
Given the a prompt, candidate A, and candidate B, choose which is the better response, based off of quality of the writing and following the prompt. Return which one is better, either A or B:
=== PROMPT ===

{prompt}

=== CANDIDATE A ===

{candidate_a}

=== CANDIDATE B ===

{candidate_b}
All prompts end with the same prompt/candidate_a/candidate_b text, so I remove that in following prompts for simplicity
Coherence
Given the prompt, candidate A, and candidate B, choose which response is more coherent.
Coherence means the response has a clear through-line, logical progression, consistent claims or story details, and no confusing jumps or contradictions.
Return only A or B.
Creativity
Given the prompt, candidate A, and candidate B, choose which response is more creative.
Creativity means the response uses fresh ideas, vivid details, distinctive phrasing, and non-generic development while still fitting the assignment.
Return only A or B.
Clarity
Given the prompt, candidate A, and candidate B, choose which response is clearer.
Clarity means the response is easy to follow, precise, readable, well organized, and avoids muddled wording or unnecessary ambiguity.
Return only A or B.
Prompt Relevance
Given the prompt, candidate A, and candidate B, choose which response is more relevant to the prompt.
Relevance means the response follows the user's assignment, respects stated constraints, addresses the requested topic, and avoids drifting into unrelated material.
Return only A or B.
Depth
Given the prompt, candidate A, and candidate B, choose which response has more depth.
Depth means the response goes beyond surface-level points, develops ideas with substance, gives meaningful detail, and shows insight appropriate to the assignment.
Return only A or B.
Token Analysis
When changing the sampling parameters, I saw that this increases the L2 distance between the output vs. reference token distribution. What tokens are the main contributors?
I took the top 1000 tokens, and ordered them by which had the largest relative difference compared to their frequency in human data. This is for a 14B model trained with SFT, using T=0.8
| Token | Relative frequency compared to human output |
|---|---|
| " the" | +19% |
| "." | +19% |
| " is" | +44% |
| " The" | +90% |
| " a" | +15% |
| " to" | +11% |
| " that" | +25% |
| " are" | +31% |
| " was" | +49% |
| " of" | +5% |
These tokens are already very common. Part of the reason they contribute the most to the L2 distance is because they are so common (e.g. if the frequency is 1% more common on these tokens, it contributes much more to the metric than being 1% more common for a rare token). For 14B SFT model with temp=0.8, the top 10 tokens contribute 87.2% of the L2² value (you need to square L2 for top X contribute Y metrics to make sense), so most of the token distance comes from common tokens that become more common.
Output Diversity
LLMs tend to overuse certain words and grammatical phrases. It's more than just the common obvious ones like emdashes and delve. For example, multiple models frequently use "Elara Voss" (Read) when then need to come up with a name.
To quantify diversity, I used self-BLEU (Zhu) to compare model outputs with the outputs from different prompts. Here lower is better. I don't use the SFT super baseline here because it's possible to make self-BLEU arbitrarily low by setting the temperature high and making the output random gibberish. For reference, I give the value for the SFT models with temp=0.9.
| Model Size | Human reference | SFT temp=0.9 | DFT |
|---|---|---|---|
| 4B | 0.061 | 0.080 | 0.064 |
| 8B | 0.061 | 0.0811 | 0.066 |
| 14B | 0.061 | 0.0790 | 0.063 |
A more concrete way to measure output diversity is to show that DFT avoids overusing the same tokens, like how other LLMs do with emdash, which I do in the next Appendix.
Avoiding Slop Signs
To measure tokens that get overused, I first filtered to all tokens that appear in at least 2% of LLM responses (this is necessary since doing this analysis on rarer tokens results in noise from low frequency tokens)
I then compared the token frequencies with a set of human responses to find any tokens that were overused in DFT responses compared to human writing. I did this by using two sets of prompts, A and B, and comparing LLM-A vs human B and human-A vs human-B for a baseline. From this we see that any tokens that seem overused (high relative diff in token frequency) match the same overuse as human vs. human (i.e. the overuse is just due to noise)
The "Human Frequency" column counts the percentage of outputs that contain this token, not the percentage of all tokens.
For reference, here's the table for GPT 5:
TABLE 12a DFT VS HUMAN
OUR MODEL
| Token | Rel. diff | Human freq |
|---|---|---|
| file | 5.7 | 1.1% |
| smoking | 3.4 | 0.7% |
| routine | 2.8 | 0.8% |
TABLE 12b HUMAN VS HUMAN
CONTROL
| Token | Rel. diff | Human freq |
|---|---|---|
| file | 4.1 | 1.1% |
| faith | 3.4 | 0.9% |
| items | 2.7 | 0.9% |
TABLE 12c GPT 5 VS HUMAN
FRONTIER MODEL
| Token | Rel. diff | Human freq |
|---|---|---|
| corridors | 45.2 | 0.1% |
| norms | 43.1 | 0.1% |
| align | 36.0 | 0.2% |
| metrics | 27.2 | 0.2% |
| engagement | 26.5 | 0.2% |
| … | … | … |
| — | 5.1 | 18.6% |
| targeted | 5.1 | 1.6% |
| identity | 5.0 | 1% |
| trust | 4.9 | 1.2% |
All three panels share one relative-difference scale, 0 to 45.2. Rows omitted in the paper remain marked by an ellipsis.
The first set of tokens are overused because they appear in ~0.1–0.3 percent of human outputs in the dataset, but appear in 5–10% of GPT 5 outputs. When ranked by relative increase, emdashes actually have a much lower relative increase, but that's mostly because they already appear in 18.6% of human outputs in the dataset. When you look at the tokens after that (targeted, identity, etc.) you get overused tokens that are more comparable to the rates seen from DFT. So if you can't tell that GPT 5 is overusing targeted/identity/trust, then you shouldn't see any overused tokens from a DFT model.
Author's Note
A stronger eval would be to run a statistical test to see if there is any difference between token distributions. The DFT outputs do not pass that test yet, but I hope to fix that with a larger model.
Limitations
Compute & scale
Most model training was done on my home GPU server, the exceptions were using cloud H100's for the superbaseline full fine tuning, which is too slow on my server. All DFT training used a sequence of LoRA (Hu, Lialin). As seen in the graphs above, the larger models have better MMD/token distribution/JMQ scores, so there will be some improvements just from scaling up the size of the baseline. However, existing models all have very clear LLM generated style, so I believe that even at the largest model sizes, there will still be room for DFT to improve outputs.
Training domain
Note that the demo was trained on a subset of fineweb, a collection of web documents. This should make the demo models good at blogs/news articles, but it is unlikely to do as well at creative writing, since it has not been trained for that use case yet.
Anti-Slop Considerations + Future Vision
Since DFT outputs are much more humanlike than other model outputs, this technology has potential for abuse for spammers/misinformation/social media slop accounts, so I want to address mitigations I've implemented, and my thoughts on the problem of slop.
LLMs are not the cause of slop. Lack of effort/care is. If you spend days researching and planning a blog post, and put all the information into a detailed, well-structured outline, and ask ChatGPT to generate the post based on the outline, then the output will be interesting to read, even if the text has a lot of em-dashes.
To encourage more thought, I've added formatted the input so you need to add a prompt, outline of the response (including any stats/quotes), writing style, and use case. These extra inputs are not required for the DFT algorithm to work, they're just there to force people to think more about what they're writing.
To prevent blindly copy-pasting from the demo without carefully reading the output, I've injected random fruit or cute animals into the output (e.g. model output is "DFT is awesome", but when you copy and paste, it could be "otter is awesome").
I want this to be a tool that allows people to write better by letting them focus on the content of what they write, without needing to waste time typing out every individual character. It should let people who have done cool projects share their work in ways that other people will understand and appreciate, without being bottlenecked by their writing abilities.
Right now, LLMs for writing are like GPT4 for coding. People think that LLMs help them write, but it's actually just adding bugs faster. I'm making the next generation of LLMs for writing, where "written with LLM" guarantees clear, engaging text that you won't be annoyed to read.
Prior Work
Other work has measured the difference between training data and model outputs (PillutlaAs seen in Appendix 3, MAUVE saturates, scoring .997+ for the 4B baseline., AlihosseiniThis paper suggests FID using BERT. I test FID in Appendix 3, but don't use it for a key metric since Fréchet metrics assume the underlying distribution is Gaussian, which is not true for language.), but the combination of MMD, L2 Token distribution, and JMQ gives the fullest picture of both content and style.
There is existing work using imitation learning make the model better match the training data distribution, specifically TextGail (Qingyang, Ho), and IQLearn (Wulfmeier). However these performed poorly in this case. Textgail outperformed SFT when the output was restricted to only 64 tokens, but failed when scaled up to length 1024 due to training instabilities, despite many attempts and modifications. For fixed sampling parameters, IQLearn could outperform SFT for certain metrics (e.g. at temp 0.9 for a 4B model, IQLearn improves JMQ from .09 to .25, and improves rouge .491 to 498, consistent with (Wulfmeier)), there was no single sampler setting for IQLearn that could beat the super baseline.
Citation
If you want to cite this, please use:
@misc{rosmine_DFT,
author = {Rosmine},
title = {Fixing LLM writing with Distribution Fine Tuning},
year = {2026},
month = May,
howpublished = {\url{https://rosmine.ai/?p=753}},
}References
Alihosseini, Danial, Ehsan Montahaei, and Mahdieh Soleymani Baghshah. "Jointly measuring diversity and quality in text generation models." Proceedings of the Workshop on Methods for Optimizing and Evaluating Neural Language Generation. 2019. arXiv.
Babakhin, Yauhen, et al. "Llama-Embed-Nemotron-8B: A Universal Text Embedding Model for Multilingual and Cross-Lingual Tasks." arXiv preprint arXiv:2511.07025 (2025). arXiv. Model.
Braverman, Mark, et al. "Calibration, entropy rates, and memory in language models." International Conference on Machine Learning. PMLR, 2020. arXiv.
Borgwardt, Karsten M., et al. "Integrating structured biological data by kernel maximum mean discrepancy." Bioinformatics 22.14 (2006): e49-e57. Article.
Heusel, Martin, et al. "Gans trained by a two time-scale update rule converge to a local nash equilibrium." Advances in neural information processing systems 30 (2017). arXiv.
Ho, Jonathan, and Stefano Ermon. "Generative adversarial imitation learning." Advances in neural information processing systems 29 (2016). arXiv.
Holtzman, Ari, et al. "The curious case of neural text degeneration." arXiv preprint arXiv:1904.09751 (2019). arXiv.
Hu, Edward J., et al. "Lora: Low-rank adaptation of large language models." Iclr 1.2 (2022): 3. arXiv.
Kimi Team. "Kimi k2: Open agentic intelligence." arXiv preprint arXiv:2507.20534 (2025).
Laurito, Walter, et al. "AI–AI bias: Large language models favor communications generated by large language models." Proceedings of the National Academy of Sciences 122.31 (2025): e2415697122. arXiv.
Lialin, Vladislav, et al. "Relora: High-rank training through low-rank updates, 2023." arXiv.
Meister, Clara, et al. "Locally typical sampling." Transactions of the Association for Computational Linguistics 11 (2023): 102-121. arXiv.
OpenAI. "Where the goblins came from" openai.com.
Panickssery, Arjun, Samuel R. Bowman, and Shi Feng. "Llm evaluators recognize and favor their own generations." Advances in Neural Information Processing Systems 37 (2024): 68772-68802. arXiv.
Papineni, Kishore, et al. "Bleu: a method for automatic evaluation of machine translation." Proceedings of the 40th annual meeting of the Association for Computational Linguistics. 2002. Paper.
Penedo, Guilherme, et al. "The fineweb datasets: Decanting the web for the finest text data at scale." Advances in Neural Information Processing Systems 37 (2024): 30811-30849. arXiv.
Pillutla, Krishna, et al. "Mauve: Measuring the gap between neural text and human text using divergence frontiers." Advances in Neural Information Processing Systems 34 (2021): 4816-4828. arXiv.
Popović, Maja. "chrF: character n-gram F-score for automatic MT evaluation." Proceedings of the tenth workshop on statistical machine translation. 2015. Paper.
Ranzato, Marc'Aurelio, et al. "Sequence level training with recurrent neural networks." arXiv preprint arXiv:1511.06732 (2015). arXiv.
Rosmine. "Was my $48K GPU server worth it?" rosmine.ai.
Read, Max. "Who is Elara Voss?" Substack.
Welleck, Sean, et al. "Neural text generation with unlikelihood training." arXiv preprint arXiv:1908.04319 (2019). arXiv.
Wu, Qingyang, Lei Li, and Zhou Yu. "Textgail: Generative adversarial imitation learning for text generation." Proceedings of the AAAI Conference on Artificial Intelligence. Vol. 35. No. 16. 2021. arXiv.
Wulfmeier, Markus, et al. "Imitating language via scalable inverse reinforcement learning." Advances in Neural Information Processing Systems 37 (2024): 90714-90735. arXiv.
Yang, An, et al. "Qwen3 technical report." arXiv preprint arXiv:2505.09388 (2025). arXiv.
Zhu, Yaoming, et al. "Texygen: A benchmarking platform for text generation models." The 41st international ACM SIGIR conference on research & development in information retrieval. 2018. arXiv.